date: 2024-09-24 title: 给vuepress2添加热力图 categories:
- vuepress tags:
- vuepress组件
给vuepress2添加热力图
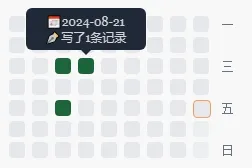
使用Memos的都知道老版的Memos都有个热力图功能,和flomo的热力图是一样的。于是我也想在vuepress2中实现一样的热力图。一开始准备写个插件,结果发现我的水平写vuepress的插件实在是太难了,就写了个自定义组件。
获取vuepress2所有文章列表
参考VuePress2 自定义插件获取所有文章列表,可以看作者原文,原作者代码拿来即用,此处不加赘述。
制作活动热力图组件
安装依赖
npm install moment
制作热力图组件
新建src/components/ActivityCalendar.vue,添加如下代码:
<template>
    <div>
        <div class="calendar-grid">
            <div v-for="(day, index) in days" :key="`${day}-${index}`" class="cell" :class="[
                getCellAdditionalStyles(dayData[day] || 0, maxCount, $isDarkmode, day),
                isToday(day, $isDarkmode),
            ]" @click="day && dayData[day] && onClick && onClick(day)">
                <span v-if="day" class="tip">{{ getTooltip(day) }}</span>
            </div>
            <!-- Week labels -->
            <div v-for="(label, index) in dayLabels" :key="index" class="week-label">
                {{ label }}
            </div>
        </div>
    </div>
</template>

<script setup lang="ts">
import { computed, ref, watchEffect, defineProps } from 'vue';
import moment from 'moment';

interface Data {
    data: Record<string, number>;
    onClick?: (date: string) => void;
}
// Define props
const props = defineProps<Data>();


const DAILY_TIMESTAMP = 3600 * 24 * 1000

// Configuration
const tableConfig = { width: 9, height: 7 };

// Helper functions
const getInitialUsageStat = (usedDaysAmount: number, beginDayTimestamp: number) => {
    const initialUsageStat: string[] = [];
    for (let i = 1; i <= usedDaysAmount; i++) {
        initialUsageStat.push(moment(beginDayTimestamp + DAILY_TIMESTAMP * i).format('YYYY-MM-DD'));
    }
    return initialUsageStat;
};

const getCellAdditionalStyles = (count: number, maxCount: number, isDarkmode: boolean, day: string | null) => {
    // if (count === 0) {
    //     if (day !== null) {
    //         return isDarkmode ? 'bg-gray-700' : 'bg-gray-200';
    //     } else {
    //         return isDarkmode ? 'bg-gray-700 opacity-6' : 'bg-gray-200 opacity-6';
    //     }
    // }
    const ratio = count / maxCount;
    if (ratio > 0.7) {
        return 'bg-green-700';
    } else if (ratio > 0.4) {
        return 'bg-green-500';
    } else if (ratio > 0) {
        return 'bg-green-400';
    } else {
        if (day !== null) {
            return isDarkmode ? 'bg-gray-700' : 'bg-gray-200';
        } else {
            return isDarkmode ? 'bg-gray-700 opacity-6' : 'bg-gray-200 opacity-6';
        }
    }
};
//判断是否为今天,给今天加边框
const isToday = (date: string, isDarkmode: boolean) => {
    if (moment(new Date()).format("YYYY-MM-DD") === date) {
        if (isDarkmode) {
            return 'border-zinc-300'
        } else {
            return 'border-gray-900'
        }
    }
    else {
        return
    }
};
//
const getTooltip = (day: string | null) => {
    if (!day) {
        return
    }
    return `📅${day}\n✒️写了${props.data[day] || 0}条记录`;
};

// Calculate today's timestamp and the number of days to be displayed
const todayTimestamp = moment().valueOf();
const weekDay = moment(todayTimestamp).day();
const emptyCells = Array(7 - weekDay).fill(null)
const todayDay = weekDay === 0 ? 7 : weekDay;
const usedDaysAmount = (tableConfig.width - 1) * tableConfig.height + todayDay;
const beginDayTimestamp = todayTimestamp - usedDaysAmount * DAILY_TIMESTAMP;
const days = computed(() => [...getInitialUsageStat(usedDaysAmount, beginDayTimestamp), ...emptyCells])
const dayData = computed(() => {
    const result: Record<string, number> = {};
    Object.keys(props.data).forEach(key => {
        result[key] = props.data[key];
    });
    return result;
});
const maxCount = computed(() => Math.max(...Object.values(props.data)));
const dayLabels = computed(() => ['一', '', '三', '', '五', '', '日']);

// Watch for changes in the data prop
watchEffect(() => {
    // Recalculate maxCount when data changes
});
</script>

<style scoped lang="scss">
.calendar-grid {
    width: fit-content;
    /* w-fit */
    height: auto;
    /* h-auto */
    margin-top: 2px;
    /* mt-2 */
    padding: 0.5rem;
    /* p-0.5 */
    flex-shrink: 0;
    /* shrink-0 */
    display: grid;
    /* grid */
    grid-template-columns: repeat(10, 1fr);
    /* grid-cols-10 */
    grid-template-rows: repeat(7, 1fr);
    /* grid-rows-7 */
    grid-auto-flow: column;
    /* grid-flow-col */
    gap: 3px;
    /* gap-[3px] */

    .cell {
        width: 1rem;
        /* w-4 (1rem = 16px) */
        height: 1rem;
        /* h-4 (1rem = 16px) */
        border-radius: 0.25rem;
        /* rounded-sm (0.25rem = 4px) */
        display: flex;
        /* flex */
        justify-content: center;
        /* justify-center */
        align-items: center;
        /* items-center */
        position: relative;

        &.border-gray-400 {
            border: 1px solid;
            /* border */
            border-color: #9ca3af;
        }

        &.border-gray-900 {
            border: 1px solid;
            border-color: var(--theme-color);
        }

        &.border-zinc-300 {
            border: 1px solid;
            /* border */
            border-color: #d4d4d4;
        }

        &.bg-gray-200 {
            background-color: #e5e7eb;
        }

        &.bg-gray-700 {
            background-color: #4b5563;
        }

        &.bg-green-700 {
            background-color: #1c643a;
        }

        &.bg-green-500 {
            background-color: #22c55e;
        }

        &.bg-green-400 {
            background-color: #4ade80;
        }

        &.opacity-8 {
            opacity: 0.8;
        }

        &.opacity-6 {
            opacity: 0.6;
        }

        &.opacity-4 {
            opacity: 0.4;
        }

        &.hascell {
            background-color: var(--theme-color);
        }

        .tip {
            visibility: hidden;
            font-size: xx-small;
            width: 120px;
            background-color: #1f2937;
            color: #d4d4d4;
            text-align: center;
            border-radius: 6px;
            padding: 5px 0;
            position: absolute;
            z-index: 1000;
            bottom: 150%;
            left: 50%;
            margin-left: -60px;
            white-space: pre-wrap;

            &:after {
                content: "";
                position: absolute;
                top: 100%;
                left: 50%;
                margin-left: -5px;
                border-width: 5px;
                border-style: solid;
                border-color: #1f2937 transparent transparent transparent;
            }
        }

        &:hover .tip {
            visibility: visible;
        }

    }

    .week-label {
        margin-left: 0.25rem;
        /* ml-1 (0.25rem = 4px) */
        width: 1rem;
        /* w-4 (1rem = 16px) */
        height: 1rem;
        /* h-4 (1rem = 16px) */
        font-size: 0.75rem;
        /* text-xs (0.75rem) */
        display: flex;
        /* flex */
        justify-content: center;
        /* justify-center */
        align-items: center;
        /* items-center */
        color: #6b7280;
        /* text-zinc-500 (近似值) */
        font-family: monospace;
        /* font-mono */
    }
}
</style>
绑定vuepress2文章数据到热力图组件
新建src/components/Heatmap.vue中添加如下代码:
<template>
    <div>
        <ActivityCalendar :data="activityData" @click="handleClick" />
    </div>
</template>
<script setup lang="ts">
import { usePageData } from 'vuepress/client'
import ActivityCalendar from './ActivityCalendar.vue';
import moment from 'moment';


const pages = usePageData().value.pages


// 提取 frontmatter 中的 date 并统计相同日期的数量
const activityData = calculateActivityData(pages);

function calculateActivityData(pages: any[]): Record<string, number> {
    const dateCount: Record<string, number> = {};

    pages.forEach(page => {
        if (page.frontmatter && page.frontmatter.date) {
            const isdate = moment(page.frontmatter.date)
            const date = isdate.format('YYYY-MM-DD')
            dateCount[date] = (dateCount[date] || 0) + 1;
        }
    });

    return dateCount;
}

const handleClick = (date: string) => {
    console.log(`Clicked on date: ${date}`);
};
</script>
参考vuepress-theme-hope的替换组件
新建替换组件
在src/.vuepress/components目录下新建一个文件,比如Bloggerinfo.vue。然后,在Bloggerinfo.vue中添加如下代码:
<template>
  <div>
    <BloggerInfo />
    <div>
      <Heatmap />
    </div>
  </div>
</template>
<script setup lang="ts">
import BloggerInfo from "vuepress-theme-hope/blog/components/BloggerInfo.js";
import Heatmap from '@source/components/Heatmap.vue'
</script>
通过别名替换组件
打开src/.vuepress/config.ts,找到alias,添加如下代码:
import { getDirname, path } from "vuepress/utils";
import { hopeTheme } from "vuepress-theme-hope";

const __dirname = getDirname(import.meta.url);

export default {
  theme: hopeTheme(
    {
      // 主题选项
      // ...
    },
    { custom: true },
  ),

  alias: {
    // 你可以在这里将别名定向到自己的组件
    // 比如这里我们将主题的主页组件改为用户 .vuepress/components 下的 HomePage.vue
    "@theme-hope/modules/blog/components/BloggerInfo": path.resolve(
      __dirname,
      "./components/BloggerInfo.vue",
    ),
  },
};
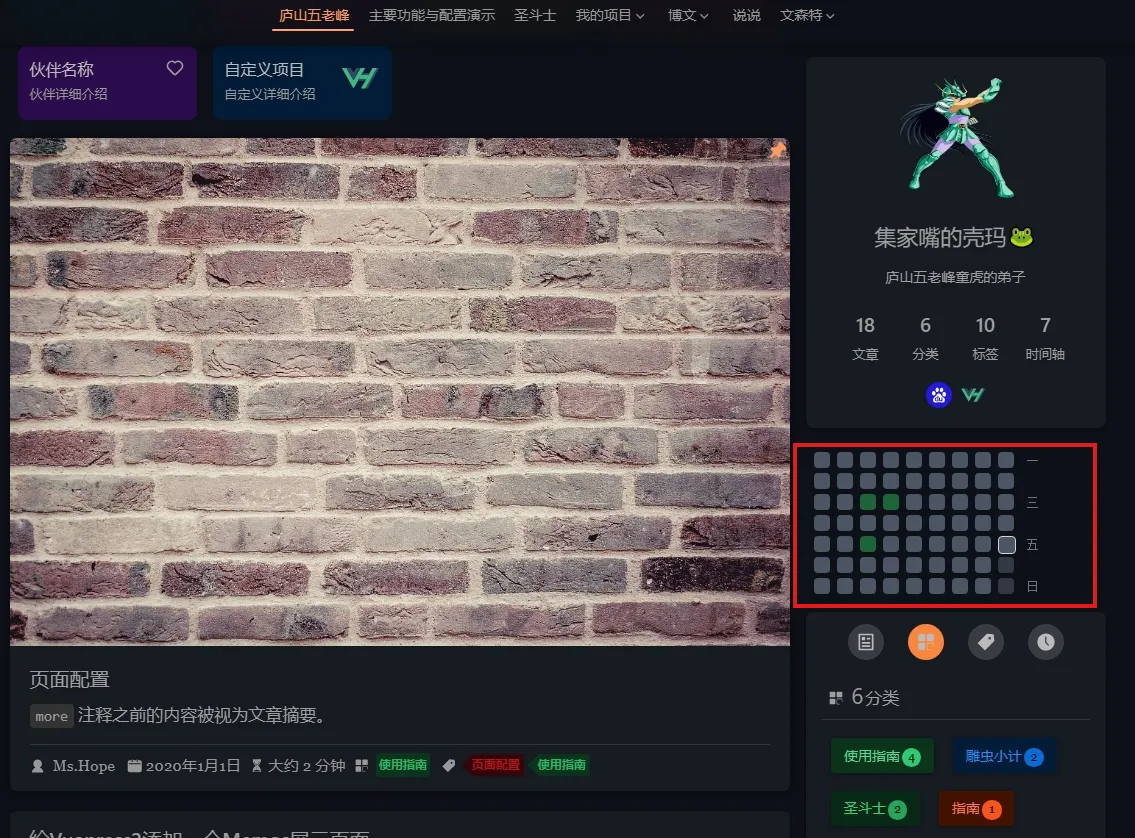
效果展示
总结
实现原理
本地数据通过vuepress2的usePageData获取,然后通过moment库解析日期,最后统计日期出现的次数,最后渲染到热力图组件中。
- 替换组件:通过别名替换组件,将主题的组件替换为自定义的组件。
- 通过
usePageData获取本地数据:通过usePageData获取本地数据,然后通过moment库解析日期,最后统计日期出现的次数。 - 渲染到热力图组件中:将统计的数据渲染到热力图组件中,通过css样式控制颜色和透明度,实现热力图效果。
薄弱环节
- Tailwindcss与vuepress-theme-hope主题有些许冲突,不能够使用主题本身的深色模式和主题色。
- 鼠标悬浮提示信息通过css样式hover样式可以直接添加,完全不需要JavaScrip代码控制。
- 本来热力色块采用主题色跟随变化,强弱使用透明度来区分,但是由于透明度属性造成鼠标悬浮提示信息被遮挡的感觉,所以最后改为固定色块来显示。
- 前端代码尤其是CSS控制,是非常薄弱的环节,需要多加练习,多加努力。